Network Diagrams
Overview
IPF has two different network diagram presentations. One is the display you see in the GUI graphics, and the other is the hard copy map. The display is for convenience in accessing system data graphically - it does not represent what the plotted map will look like, nor does it need to be ‘pretty’. The hard copy diagram is designed for reports, documentation, and analysis. It can be generated as a report from the graphic display or produced in a batch environment. This section addresses the hard copy diagram which is designed for reports, documentation, and analysis.
Both presentations use the same coordinate file format. The most important coordinate data, like bus icon and name locations, and line bending points, can be edited graphically from the GUI by moving things around and saving the altered coordinate file. However, you will have to plot out the map in order to see how your changes have affected the hard copy appearance.
The basic diagram shows power system components modeled in a power flow study. The diagram is less detailed than a Powerflow listing, but may have more (or different) information than the graphic display. It shows essential bus and branch solution data. The diagram also shows identification data. For example, it shows date, case identification, program version, and the options used to generate the diagram. The diagram can be enhanced by adding to the coordinate file such items as:
A legend.
A border.
A control block for case identification, signatures, etc.
A case title heading.
Selected tie line flows and loss summary.
An inset showing detail in a selected area.
Any PostScript language objects.
These items will show up on the map plotted from the GUI, even though many of them cannot be
added or edited from the GUI. For details on all the hard copy diagram options and capabilities,
and the usage of the ipfplot and ipfbat programs, see ipfplot and ipfnet.
Input Requirements, Output, and Operation
The Plot function is a set of FORTRAN subroutines within ipfmain, which build a dynamic
PostScript objects file of references to a static PostScript objects file (pfmaster.post). The same
routines are called by the Print Plot command issued from the GUI, a command file entered via
ipfbat or the GUI, and by the batch program ipfplot. The dynamic file, which is built by
“anding” a coordinate file with powerflow data, defines which data will appear on a diagram. The
static ASCII PostScript file describes how data will appear on a diagram.
When you load a coordinate file, for example name.cor, into the GUI, the program copies the
contents of the file into name.tmp. Any changes you make during your interactive session are
reflected in the latter file. They will disappear when you exit IPF unless you Save the coordinate
file before exiting.
When you select the Print Plot item on the File menu, IPF uses the intersection of the name.tmp
file and the currently loaded system data to define which data will appear on the diagram. It then
combines this with the file pfmaster.post, which describes how data will appear on the diagram.
The result is a name.ps file, which is sent to a PostScript-capable printer using the Printer
Destination string you have selected.
Input Requirements
The input requirements are:
A coordinate file, built via the GUI and/or an ASCII text editor.
A solved system network, either from a base case file or currently loaded in IPF.
The static PostScript file (
pfmaster.post) defining how data will be shown on thediagram.
Output
A dynamic PostScript file, which is built by the Plot program, is appended to the static PostScript file and sent to a PostScript interpreter (printer or computer display) to produce a diagram.
Plot Program Operation
GUI: Select Print Plot from the File pull-down menu. You can also change the options for the particular plot, by selecting Diagram Options and/or Page Options. These override the options which may be specified in the coordinate file.
ipfbat: See ipfnet.
ipfplot: Enter ipfplot coordinate_file base_file_1 [base_file_2]. This is a strictly
batch process which does not require the GUI. A coordinate file name and one solved base file must
be provided. The second base file is required only for difference maps.
However it is invoked, the Plot program determines which information should appear on the diagram by examining the coordinate file. It then searches the Powerflow data for bus, branch, area, and intertie data that are identified in the coordinate file. When a match is found, the Powerflow and coordinate data are combined and formatted into a dynamic PostScript file to activate procedures on the static PostScript file. In addition to bus, branch, transformer, area, and intertie records, all other coordinate file records — options, draw, >define, comment, and PostScript — are processed by the Plot program and formatted to invoke procedures on the static PostScript file.
Coordinate File
The coordinate file used by the diagram program is the same file that is generated and used by the GUI display. Since the coordinate file is an ASCII file, it can be generated by any ASCII text editor. The records in that file are described in this section.
The Coordinate file consists of primary coordinate data records and supportive coordinate data records. All coordinates are first quadrant positive Cartesian coordinate values in centimeters. The lower left corner of the diagram is coordinate (0,0). The primary coordinate data records those which specify the bus and branch (bend) locations. These records are:
Bus Record
BLine Record
LTransformer Record
TArea Record
AIntertie Record
I
The Coordinate file may also include supportive record types to produce a diagram suitable for long term documentation. These records are:
File Identification Record
[ID COORDOptions Record
ODefine Record
>DEFINE_TYPEComment Record
CDraw Record
DPostScript Record
PTrailer Record
9or(*EOR)
For complete details on all of the coordinate file records, see ??.
File Indentification Record - [ID COORD
The file identification record signifies the beginning of a set of coordinate records. See the table
below. Options are set to their default condition when this record is encountered. One such record is
required at the beginning of the coordinate file, but it may optionally contain several [ID COORD
records and their associated coordinate record sets. Multiple [ID COORD records may be used to
insert a control block, legend, or an inset of a detailed section of the diagram.
Column |
Format |
Description |
|---|---|---|
1-9 |
A9 |
|
9-90 |
Not used by Plot program, available for user notes. |
Options Record - O
Options affect the general appearance of a diagram and determine which Powerflow data will be displayed for each bus and branch on a diagram.
The default option values can be overridden by options specified in the coordinate file. If a coordinate file is currently loaded in the GUI, and the options are changed via the Page Options or Diagram Options menus, these will override (replace) those originally specified in the file. If the file is saved, the new options will be saved in it.
The = and , and blank field delimiters may be used interchangeably. Option names may be
upper or lower case. Upper case characters shown in the tables indicate the minimum mandatory
characters for identifying the option.
Column |
Format |
Description |
|---|---|---|
1-2 |
A 2 |
|
3-90 |
A 88 |
Free field description of option, see tables below for details. |
Here is an example of how to specify options in the coordinate file::
OPtions OR=L
Options SCale_factor=0.9,0.9
OP BUs_detail=Bus_name,Powerflow_name
Page Options These are general appearance options. Several of them are interdependent. They are applied in the following order:
Orientation
Scale
Offset
Border with transparency flag
Box for identification
Case location
Comment location
Coordinate file name location
Size
Legend location
The option values can be set on the Diagram Options menu.
Option |
Description |
|---|---|
SIze=XX.XX,YY.YY |
DEFAULT = 21.59 by 27.94 cm (8.5 by 11 inches). |
ORientation=Landscape ORientation=Portrait |
DEFAULT=Portrait. |
OFfset=XX.XX,YY.YY |
Lower left of diagram relative to lower left of page. DEFAULT = 0.0, 0.0. |
TRansparency=Transparent TRansparency=Opaque |
DEFAULT for insets is Opaque. Main diagram is always opaque. |
SCale_factor=X.XX,Y.YY |
DEFAULT = 1.0, 1.0. |
BOrder=XX.XX,YY.YY |
Locates upper right corner of border. DEFAULT = no border. |
BX=XX.UL,YY.UL,XX.LR,YY .LR |
Locates an identification box. XX.UL and YY.UL locate the upper left corner of the box. If XX.LR and YY.LR are zero (0), the box is positioned in the lower right corner of the diagram. Default coordinates are established for CR (coordinate file), CAse_name, and COmments. These locations can be overridden. A standard border is drawn as near the edge of the paper as most PostScript printers will allow. DEFAULT = no identification box. |
CAse_name=XX.XX,YY.YY |
Locates case name from Powerflow program. DEFAULT = no case name. |
COmments=XX.XX,YY.YY |
Locates comments from user entry and Powerflow program. DEFAULT = no Powerflow comments. |
CR=XX.XX,YY.YY |
Locates coordinate file name DEFAULT = relative to BX. |
LG=XX.XX,YY.YY |
Locates upper left corner of legend box. DEFAULT = no legend. |
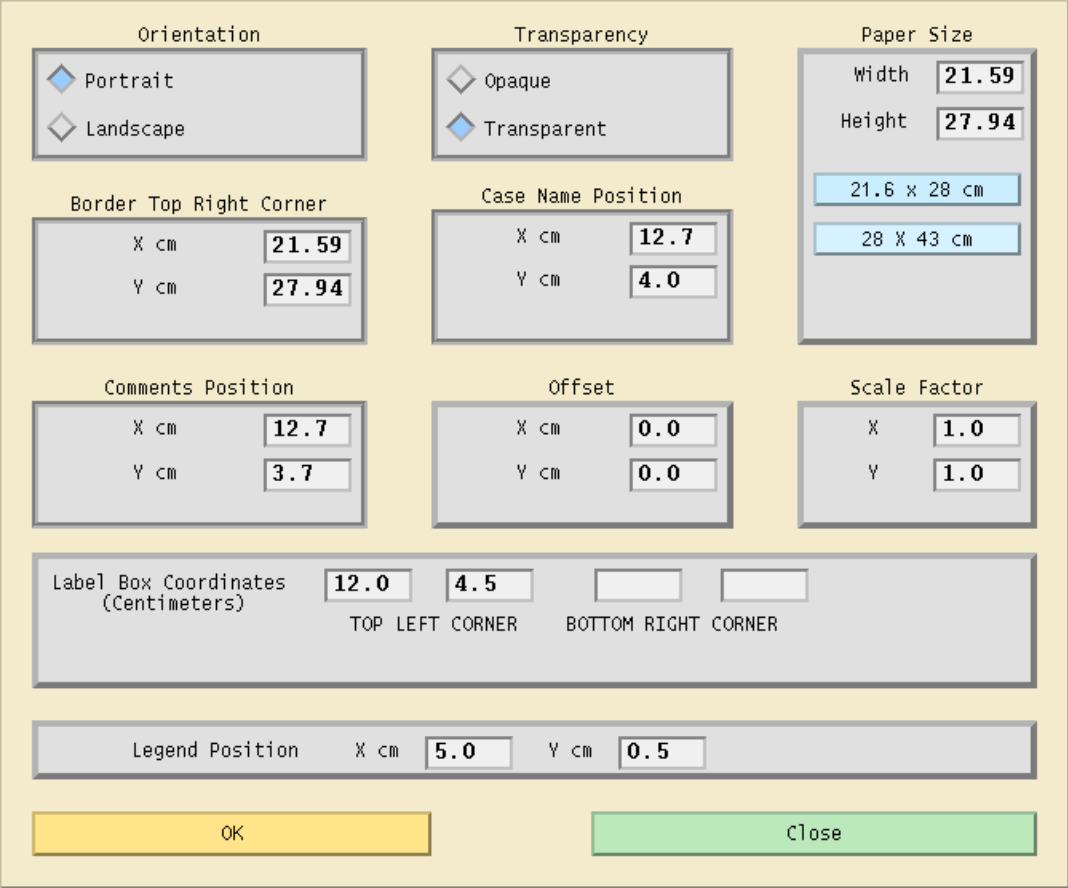
Fig. 146 Page Options Dialog Box
Diagram Options
The options described in the table below determine which powerflow values will be displayed on a diagram.
Those selections that are ON by DEFAULT may be turned off in one of two ways. Some, such as the
bus name selection, may be toggled to the abbreviations on the bus coordinate records, full bus
name, or full bus name and base kv. Others, such as generation, may be turned off by preceding
the value of interest with NO_. For example, to not show generation::
Option BUs_detail=NO_Generation
or
O BU=NO_G
You can also specify on the bus coordinate record whether or not the generation and shunt reactance at this bus should be displayed. See bus coordinate records in Table ?? and Figure ?? for details. The no display indicator on the coordinate records can be overridden with a draw more or alwaws draw option for generators or shunt reactors. For example,:
Op BUs_detail=AL_Generators
Op BUs_detail=MO_Generators
Option BUs_detail=AL_Shunt
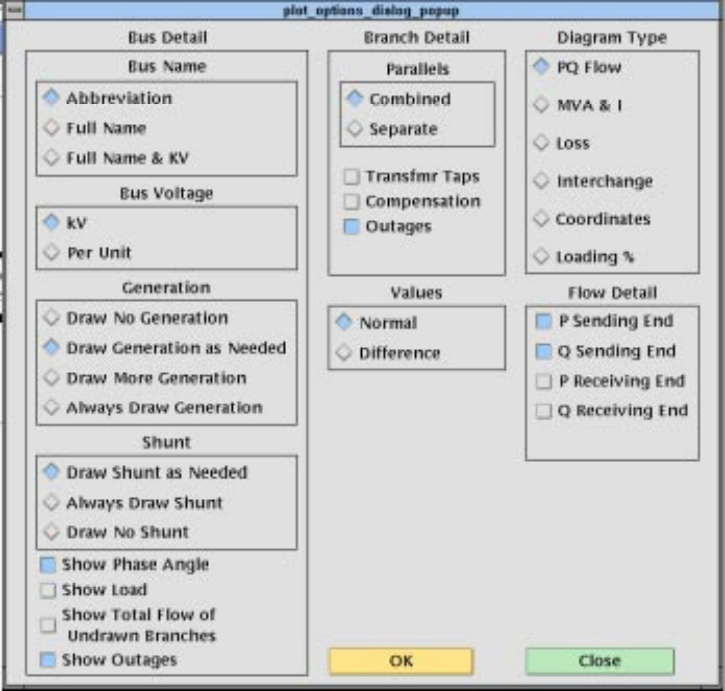
Fig. 147 GUI Diagram Options
Some of the diagram options are independent; others are mutually exclusive. Look at the GUI menu above to quickly determine which is which. Those with diamond buttons are exclusive; those with square buttons can be turned on or off in any combination. This applies no matter whether the options are specified from the menu or in the coordinate file.
Option |
Description |
|---|---|
DIagram_type=Pq_flow DIagram_type=Mva/I DIagram_type=Loss DIagram_type=Interchange DIagram_type=Coordinates Diagram_type=Loading % |
See flow detail; DEFAULT Maximum values P and/or Q set via P_S, Q_S No flow data % current or % MVA rating |
VAlues=Normal VAlues=Difference |
DEFAULT case1 - case2 |
FLow_detail=P_Sending_end FLow_detail=Q_Sending_end FLow_detail=P_Receiving FLow_detail=Q_Receiving |
DEFAULT DEFAULT |
BUs_detail=Bus_name,Abbreviation BUs_detail=Bus_name,Powerflow_name (and kV) BUs_detail=Voltage,kV BUs_detail=Voltage,Per Unit BUs_detail=Angle BUs_detail=Generation BUs_detail=Shunt BUs_detail=Load BUs_detail=Total_flow of undrawn branches BUs_detail=Outages |
DEFAULT DEFAULT DEFAULT DEFAULT DEFAULT Not yet implemented. |
BRanch_detail=Trans_taps BRanch_detail=Compensation BRanch_detail=Parallels,Combined BRanch_detail=Parallels,Separate BRanch_detail=Outages |
DEFAULT Not yet implemented. |
File Management
This option is used to ‘include’ a separate file of coordinate data into the current file that you are
plotting. CFLOW reports can be incorporated into the diagram by this mechanism. Multiple files
may be included, if desired. This option is not presently available from the GUI. That is, if in the
GUI you load a coordinate file which includes “Option File” records, these will be ignored.
However, there is a means of including a single auxiliary coordinate file in a GUI plot. Under the
File pull down menu, select Plot Options, then User Comments. Include a comment which is the
name of the file, preceded by an ampersand (&). See section :ref:`` for more information.
The ABERDEEN INSET in Figure 5.8 was created with an & record.
The included file should not be a complete, independent coordinate file. For example, if it has a
[ID COORD record, none of the file will be included. If it contains any options which have already
been defined, these will produce warning messages and will have no effect. Options which are not
defined in the main file can be defined in the included file; they will be applied to the entire
diagram.
The included file must be terminated with a (*EOR) record, or its last line will be lost.
Option |
Description |
|---|---|
File=filename |
Coordinate data from the specified file will be inserted into the current file. (This feature has not yet been implemented in the GUI.) |
PostScript Records
PostScript, >Define, Comment, and Draw records are processed in the order specified by the user. For example, a PostScript record can be used to change the font for comment records. A comment record may or may not define coordinates. If coordinates are not defined, the comment is printed below the previous comment record. A series of Draw records or a series of PostScript records is often required to accomplish a specific task.
PostScript commands, columns 3 - 82 of the PostScript records, are sent directly to the PostScript file. They have the complete versatility of the PostScript language (PSL). A typical use is to change fonts within a series of comment records or to add simple graphics to a diagram. These records could also be generated, inserted, or edited by a CFLOW program (see also Comment Records, below).
Column |
Format |
Description |
|---|---|---|
1 |
A 1 |
P - identifies a PostScript record. |
3-82 |
A 80 |
Any valid PostScript command including commands defined in pfmaster.post |
>Define Records
The define records associate solution values to variables that can be manipulated and printed within comment records. Section user-analysis provides an in-depth discussion of this feature. See the table below for the format of >DEFINE records.
Column |
Format |
Description |
|---|---|---|
1-7 |
A 7 |
>DEFINE — identifies a define record. |
1-90 |
A 90 |
See user-analysis, /USER- ANALYSIS section, Symbol Definitions. |
Draw Records
Draw records are used to draw straight lines such as borders and boxes on a diagram.
Column |
Format |
Description |
|---|---|---|
1 |
A 1 |
D - identifies a draw record. |
3-14 |
2F 6.2 |
X, Y coordinates. |
15 |
I 1 |
1 = draw or 2 = move to specified coordinates. |
16-27 |
2F 6.2 |
X, Y coordinates. |
28 |
I 1 |
1 = draw or 2 = move to specified coordinates. |
29-40 |
2F 6.2 |
X, Y coordinates. |
41 |
I 1 |
1 = draw or 2 = move to specified coordinates. |
42-53 |
2F 6.2 |
X, Y coordinates. |
54 |
I 1 |
1 = draw or 2 = move to specified coordinates. |
55-66 |
2F 6.2 |
X, Y coordinates. |
67 |
I 1 |
1 = draw or 2 = move to specified coordinates. |
68-79 |
2F 6.2 |
X, Y coordinates. |
80 |
I 1 |
1 = draw or 2 = move to specified coordinates. |
Bus Coordinate Data
The bus coordinate data describes where and how the Powerflow bus values will be displayed on the diagram. See the table and card below for the format of the bus coordinate data record.
Column |
Format |
Description |
|---|---|---|
1 |
A 1 |
B — Identifies the Bus coordinate record. This record type is created when you place a bus graphically. |
2 |
I 1 |
Display flag: 0,Blank - Display the bus symbol. 1 - Do not display the bus symbol, but print the name. This is accessed by the Hide Bus and Show Bus buttons in the Bus Coord Edit menu. |
3-10 |
A 8 |
Bus name to match Powerflow data. Used for identification. |
11-14 |
F 4.0 |
Bus kv to match Powerflow data. Used for identification. |
15-22 |
A 8 |
Name abbreviation to print on diagram. This can be edited from the Bus Coord Edit menu. |
23 |
I 1 |
Print bus voltage relative to bus name: 1 - over name 2 - right of name 3 - below name - this is the GUI-generated default 4 - left of name 5 - do not print the voltage 6 - print the voltage, but no name |
24-35 |
2F 6.2 |
X, Y of center of bus symbol. This changes whenever you move a bus in the GUI display. |
36-47 |
2F 6.2 |
X, Y of the lower left corner of the bus name (if other than default). This changes whenever you move a bus name. |
48-50 |
F 3.0 |
Angle (in degrees) of generator symbol (0 degrees assigns X > 0, Y = 0 position Angle > 0 moves counter clockwise). An angle of 0 is a flag to not display the generator. GUI-generated default is 150 degrees. |
51-53 |
F 3.0 |
Angle of reactance symbol. An angle of 0 is a flag to not display the reactor. GUI-generated default is 120 degrees. |
54-55 |
A 2 |
Bus symbol shape identifier: Blank - round symbol - this is the default from GUI. HB - horizontal bar, length = radius x 2 VB - Vertical bar User may add other symbols corresponding to symbols added in master PostScript file. |
56-59 |
F 4.2 |
Bus symbol radius in centimeters. |
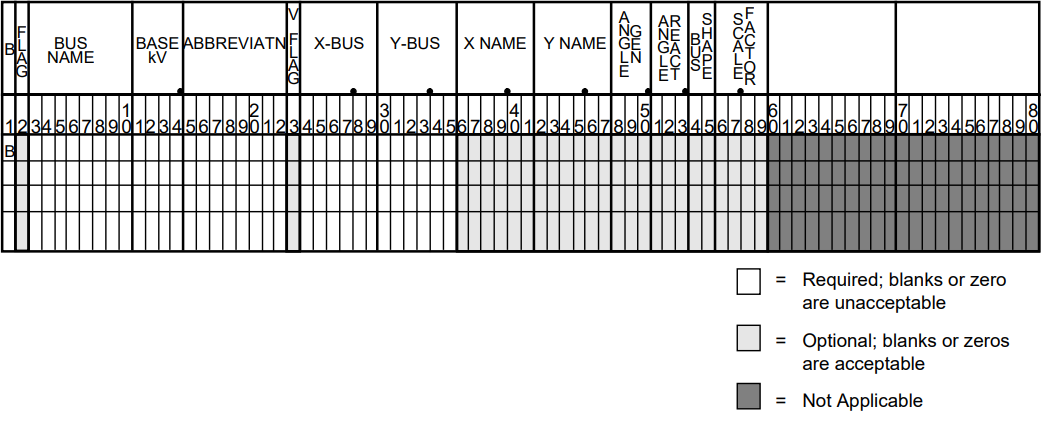
Fig. 148 Bus Coordinate Data Record
Branch Coordinate Data
The branch coordinate data describes the bending points in a branch and identifies which segment will show the flow and transformer symbol or compensation symbol. See the table and card record below for the format of the branch coordinate data record.
Column 27 requires additional explanation. Several alternative routes may be established for printing parallel circuits separately. The most preferred path is 1, next 2, etc. When the option to display parallel circuits separately is on and there are as many or more routings as circuits, the circuits are shown separately.
Column |
Format |
Description |
|---|---|---|
1 |
A 1 |
L or T identifies a Line or Transformer. This record type is generated when you place a bending point in a line or transformer. |
2 |
Not used. |
|
3-10 |
A 8 |
Bus1 name. |
11-14 |
F 4.0 |
Bus1 kV. |
15-22 |
A 8 |
Bus2 name. |
23-26 |
F 4.0 |
Bus2 kV. |
27 |
I 1 |
Circuit number for routing parallel circuits separately. Not available from GUI. |
28 |
Not used. |
|
29-30 |
I 2 |
Segment for annotation with flow. A negative number means do not show arrow and flow. Not available from GUI. |
31-42 |
2F 6.2 |
X, Y coordinates for 1st bending point. |
43-54 |
2F 6.2 |
X, Y coordinates for 2nd bending point. |
55-66 |
2F 6.2 |
X, Y coordinates for 3rd bending point. |
67-78 |
2F 6.2 |
X, Y coordinates for 4th bending point. |
79-90 |
2F 6.2 |
X, Y coordinates for 5th bending point |
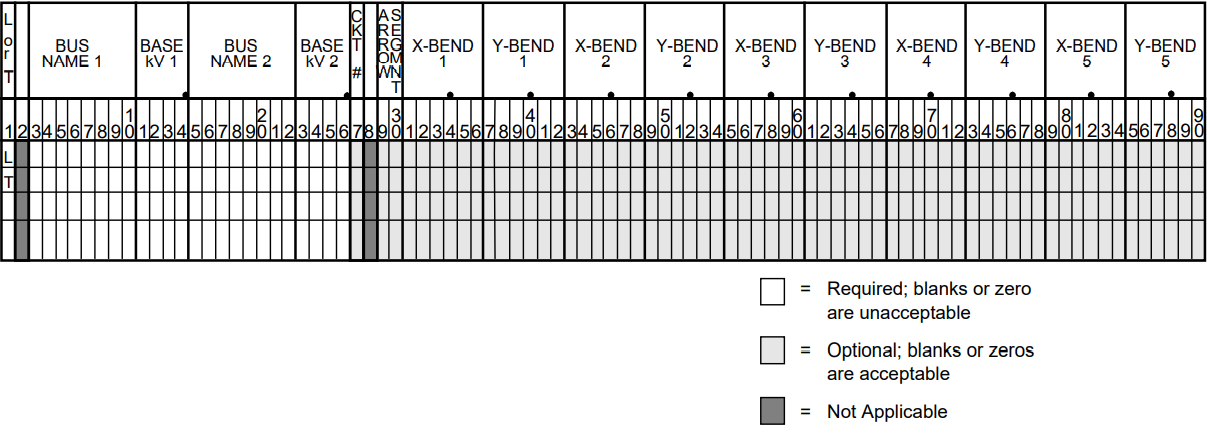
Fig. 149 Branch Coordinate Data Record
Area Coordinate Data
The area record is used to define the location of an area interchange bubble. See the table and figure below for the format of the area coordinate data record.
0, blank — Display the area symbol. 1 — Do not display the area symbol, but print the name. 3-12 A 10 Area name — Name of area as shown in IPF. 13 Not used. 14-23 A 10 Abbreviation — A name appearing on the diagram. If blank, no name is printed. 24-35 2F 6.2 X,Y of center of area symbol. 36-37 A 2 Area symbol shape identifier. (The default — blank — is a cartouche. The user may add other symbols corresponding to symbols added in the master PostScript file.) 38-41 F 4.2 Radius — Radius of circular segments of cartouche. 42-45 F 4.2 Width — Width of linear segment of cartouche. 46-90 Not used.
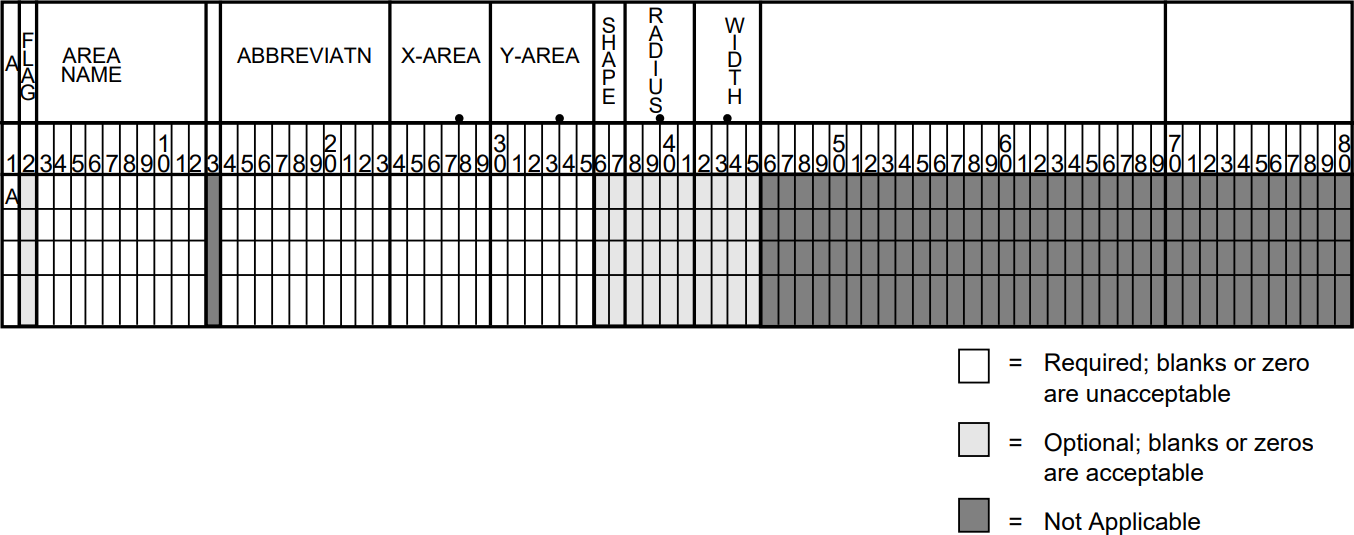
Fig. 150 Area Coordinate Data Record
Intertie Coordinate Data
The intertie record is used to locate the bending points of an intertie connecting two areas. This record becomes necessary when crowding of interties occurs. See table and figure below for the format of the intertie coordinate data record.
2 Not used. 3-12 A 10 Area 1 — Name of first area. 13 Not used. 14-23 A10 Area 2 — Name of second area. 24-28 Not used. 29-30 I 2 Segment for annotation with flow. A negative number means do not show arrow and flow. 31-42 2F 6.2 X, Y coordinates for 1st bending point. 43-54 2F 6.2 X, Y coordinates for 2nd bending point. 55-66 2F 6.2 X, Y coordinates for 3rd bending point. 67-78 2F 6.2 X, Y coordinates for 4th bending point. 79-90 2F 6.2 X, Y coordinates for 5th bending point.
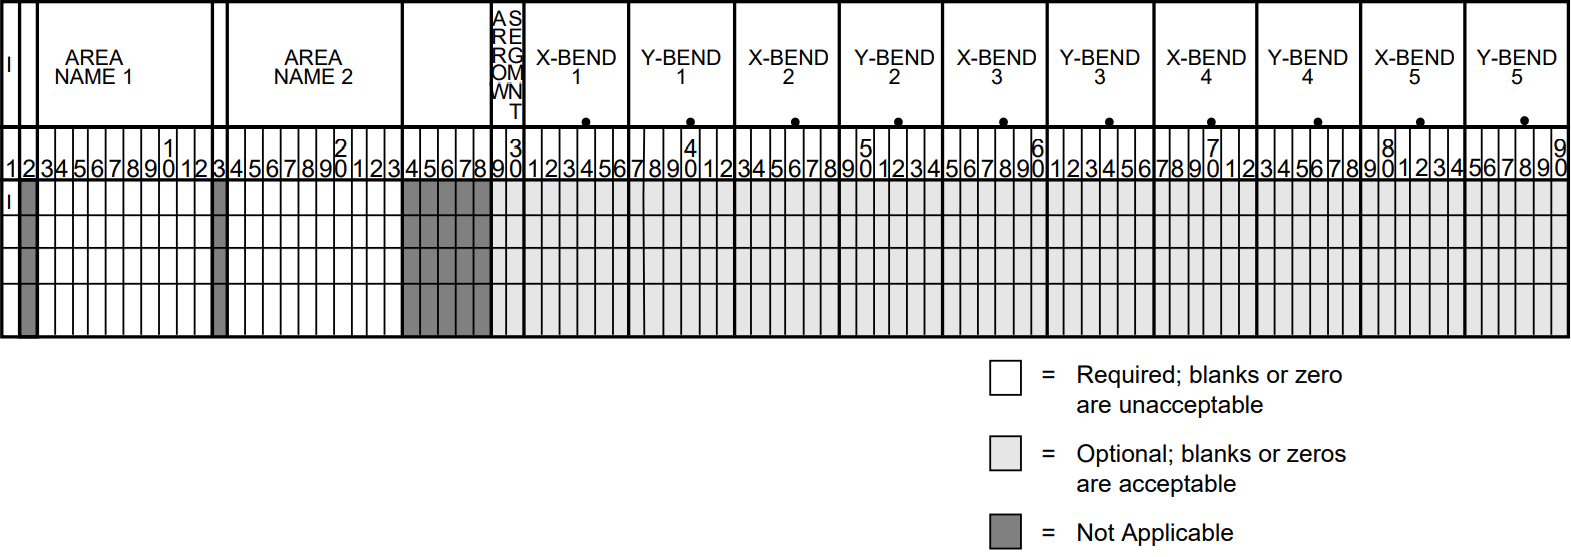
Fig. 151 Intertie Coordinate Data Record
Annotation Record
The annotation record can be used to document a data file. The record is ignored by the diagram program. You can also temporarily remove a coordinate record from service by inserting a “!”” or “#”” before it.
an annotation record. 2-90 A Any ASCII printing characters.
Trailer Record
The trailer record signifies the end of the usable data. Any records beyond the trailer record are ignored by the program. See table for the format of the trailer record.
PostScript Procedures
This section is for the advanced user who wants to customize the appearance of the diagram by modifying PostScript procedures.
The PostScript procedures are stored in ASCII form on the pfmaster.post file. The procedures
that are most likely to be changed by the user are described below.
Coordinate Data Within the Postscript Procedures File
The PostScript procedures file is used as a data repository for selected coordinate data. A % (percent
sign) as the first character of a record instructs the PostScript interpreter to process the record as a
comment. The FORTRAN program reads columns 2-79 of these comment records as coordinate
data records. These records must be within the first 100 records of the pfmaster.post file and
contain the following delimiters::
%[xx Beginning of a block 'xx' of coordinate format data
%(end) End of block
%[End End of all coordinate data in pfmaster.post repository
Diagram Identification Data
Diagram identification data is retrieved when the user requests the label box (BX) option. Typically, the identification includes:
Powerflow case name.
Date of Powerflow run.
Version of Powerflow program used to create case.
Description of Powerflow case.
Time of Powerflow run.
The identification data in the pfmaster.post file is of the form shown below. Refer to the
pfmaster.post file for the identification data in your installation.:
%%Begin data read by psplot
%[BX WSCC will change the first 7 characters to: %[BPABX
%>DEFINE_TYPE OLDBASE LET cAse=CASE
%>DEFINE_TYPE OLDBASE LET dAte=DATE
%>DEFINE_TYPE OLDBASE LET pFvr=PFVER
%>DEFINE_TYPE OLDBASE LET dEsc=DESC
%P /Helvetica-Bold findfont 10 scalefont setfont
.
.
.
%Option SSpecific Comments=20
%(end)
%[End BPA data block read by psplot --DO NOT REMOVE THIS RECORD
%[WSCCBX WSCC will change the first 4 characters of this record to: %[BX
%! ****** emulated stuff *************
%>DEFINE_TYPE OLDBASE LET tIme=TIME
%P /Helvetica findfont 07 scalefont setfont
.
.
.
%Option SSpecific Comments=03
%(end)
%[End WSCC data block read by psplot --DO NOT REMOVE THIS RECORD
Legend
The legend is in PostScript form and is used when the legend option (LG) is selected. The legend identifies line patterns with kV ranges. The user may examine the procedure acLine for a description of the operands passed to that operator.
The legend data in the pfmaster.post file is of the form shown below.:
/legndId
{
 gsave
 x-legnd y-legnd translate
 0 -4.50 cmtr translate
 newpath
 0 0 moveto 0 4.50 cmtr lineto 2.2 cmtr 4.50 cmtr lineto 2.2 cmtr 0 cmtr linet
o
 closepath stroke
 /Helvetica-Bold findfont 10 scalefont setfont
 0.4 cmtr 4.00 cmtr moveto
 (LEGEND) show
 /Helvetica-Bold findfont 08 scalefont setfont
 [ 0.10 cmtr 3.25 cmtr 2.10 cmtr 3.25 cmtr ]
 () () () 1 0 ( 0 - <100 kv) () () 0 099 acLine
 [ 0.10 cmtr 2.50 cmtr 2.10 cmtr 2.50 cmtr ]
 () () () 1 0 (100 - <200 kv) () () 0 199 acLine
 [ 0.10 cmtr 1.75 cmtr 2.10 cmtr 1.75 cmtr ]
 () () () 1 0 (200 - <231 kv) () () 0 230 acLine
 [ 0.10 cmtr 1.00 cmtr 2.10 cmtr 1.00 cmtr ]
 () () () 1 0 (231 - <500 kv) () () 0 499 acLine
 [ 0.10 cmtr 0.25 cmtr 2.10 cmtr 0.25 cmtr ]
 () () () 1 0 (500 kv and up) () () 0 500 acLine
 grestore
} def
Line Pattern Data
Line pattern data is stored in the array LinePattern. The length must be defined in
LinePatternArray. The put operator stores data in the array element indicated by the indexes 0,
1, 2, 3, etc.
The first two values in the array are the voltage range for the line pattern. Next is an array with a
nested array. The nested array is line pattern, and the other value in the offset as required by the
operator `setdash. The last value in LinePattern is the line width.
To be within a voltage range, a voltage must be greater than or equal to the minimum voltage specified and less than the maximum voltage specified.
The line patterns for outages and interchange lines are similar but without the voltage range specification.
The line pattern data in the pfmaster.post file is::
%***** LINE PATTERN DATA****************
/LinePatternArray 5 def
/LinePattern LinePatternArray array def
/LinePatternCount LinePatternArray 1 sub def
 LinePattern 0 [200 231 [ [3 6] 0 ] 1.00 ] put
 LinePattern 1 [500 2000 [ [1 1000] 0 ] 1.00 ] put
 LinePattern 2 [100 200 [ [5 1] 0 ] 1.00 ] put
 LinePattern 3 [231 500 [ [1 5] 0 ] 1.00 ] put
 LinePattern 4 [0 99999 [ [1000 1] 0 ] 1.00 ] put

%***** Line Pattern for Outage Line ******************

/LinePatternOut [ [ [1 4] 0 ] 1.00 ] def
/curve-offset 8 def

%***** Line Pattern for Interchange Line ******************

/LinePatternInt [ [ [1 10000] 0 ] 1.00 ] def
Bus Overvoltage/Undervoltage Range Values
Acceptable bus voltage range data is stored in the array VoltLim. The length must be defined in
VoltLimArray. The put operator stores data in the array element indicated by the indexes 0, 1, 2,
3, etc.
The first two values in each element of the array are a voltage range. The second two values are the minimum and maximum acceptable per unit voltages for buses in that voltage range.
To be within a voltage range, a voltage must be greater than or equal to the minimum voltage specified and less than the maximum voltage specified.
%***** BUS OVER-VOLTAGE/UNDER-VOLTAGE DATA *********
/VoltLimArray 5 def /VoltLim VoltLimArray array def /VoltLimCount VoltLimArray 1 sub def VoltLim 0 [230 500 0.95 1.052] put VoltLim 1 [500 2000 1.00 1.100] put VoltLim 2 [115 230 0.95 1.052] put VoltLim 3 [ 0 115 0.95 1.052] put VoltLim 4 [ 0 9999 1.00 1.000] put
Bus Symbols
The user may add new bus shapes or change the existing ones. The default bus shape is a circle. A
vertical bar (VB) and horizontal bar (HB) are also available. See ?? and ?? below. Bus
symbols added in the pfmaster.post file can then be associated with bus records through the bus
shape and scale factor fields on the bus coordinate record.
A typical bus symbol definition in the pfmaster.post file is the vertical bar bus symbol::
shapeIndex (VB) eq % begin drawing vertical bar
 {
 [] 0 setdash
 obj-line-width setlinewidth
 newpath % clear current point so it doesn’t show
 -.075 cmtr -1 cmtr bsScale mul moveto
 -.075 cmtr 1 cmtr bsScale mul lineto
 .075 cmtr 1 cmtr bsScale mul lineto
 .075 cmtr -1 cmtr bsScale mul lineto
 closepath
 gsave
 buscolor aload pop setrgbcolor % set backgroung color
 fill
 grestore
 fgcolor aload pop setrgbcolor % set foreground color
 exit
} if % done drawing vertical bar
Area Symbols and Bubble Plots
The user may add new area shapes or change the existing one. The default area shape is a
cartouche (round-cornered box). See ?? and ??. Area symbols added in the pfmaster.post
file can then be associated with area records through the area shape and scale factor
fields on the area coordinate record.
The default area symbol definition in the pfmaster.post file is the cartouche or bubble::
%------- The enclosed code may be customized at the user's pleasure -----

bubFlg 0 ne                            % do not draw cartouche
{ exit } if

shapeIndex ( ) eq                      % begin drawing cartouche
{
bbSz1 0 eq {/bbSz1 0.80 cmtr def} if   % setup default size for bubble
bbSz2 0 eq {/bbSz2 1.50 cmtr def} if   % setup default size for bubble
 [] 0 setdash
 bub-wall-width setlinewidth
newpath                                % clear current point so it doesn't show
 /bbSz3 bbSz2 2 div def
 bbSz3 neg 0 bbSz1 90 270 arc
 bbSz3 bbSz1 neg lineto
 bbSz3 0 bbSz1 270 90 arc
 closepath
 gsave
 bgcolor aload pop setrgbcolor         % set background color
 fill
 grestore
 fgcolor aload pop setrgbcolor         % set foreground color

 /xTxt xTxt bbSz3 sub                  % calculate new x text coordinates
   bbSz1 3 div sub def
 /yTxt yTxt 0.5 cmtr add def           % calculate new y text coordinates

 exit
 } if                                  % done drawing cartouche

%-------- The enclosed code may be customized at the user's pleasure -----
Diagram Components
Example diagrams are shown in ?? and ??.
The hard copy diagram allows buses, branches, area, and interchange symbols to be intermixed on a diagram. Typically, however, bus/branch and area interchange diagram are drawn separately.
The diagram consists of two types of components:
Supportive components such as borders, diagram identification, legend, and comments.
Primary diagram components such as buses, branches, areas, and interchange flows.
Supportive Diagram Components
The example diagrams illustrate the two different types of default options, one with an identification box in the lower left corner (BPA standard) and the other with case id and headers at the top of the page (WSCC standard).
A border is drawn as close to the edge of the paper as printers allow.
The information below the border identifies the type of diagram, the date and time the diagram was created, the Powerflow program version that created the diagram, the time that the Powerflow case was created, and the name of the coordinate file.
In example 1, the case name, the date the case was created, and the Powerflow program version
that created the case are shown on the first line within the box. A 20-character description of the
case is on the second line. Comments entered by the user at the time the diagram was created
follow. Note that the last user-entered comment on the bus/branch diagram begins with an
ampersand (&). This comment instructs the program to read additional coordinate data from the
file aberdeeninset.cor.
Blocks of text such as LOSSES on the bus/branch diagram and INTERTIE SCHEDULED ACTUAL on
the area interchange diagram are the product of >DEFINE and C records in the coordinate file.
The LG (LeGend) option selects and locates the legend shown on the bus/branch
diagram.
In example 2, an IPS-like three line title appears above the map. The first line is composed of the
case name, description, date, and program version. The other two lines were entered as headers in
the PF ID/Description menu (corresponds to command /HEADER in Power Flow Control (PFC)).
Primary Diagram Components: Bus/Branch Diagrams
The majority of the options previously discussed in the Options Record - O section refer to bus/branch diagrams. These options, along with the coordinate file, customize the diagram to the user’s specifications. In general, the diagram consists of bus and branch symbol groups and Powerflow solution values. Area and intertie information may appear on the same diagram, but there will be no connection between the two graphs, as is shown below.
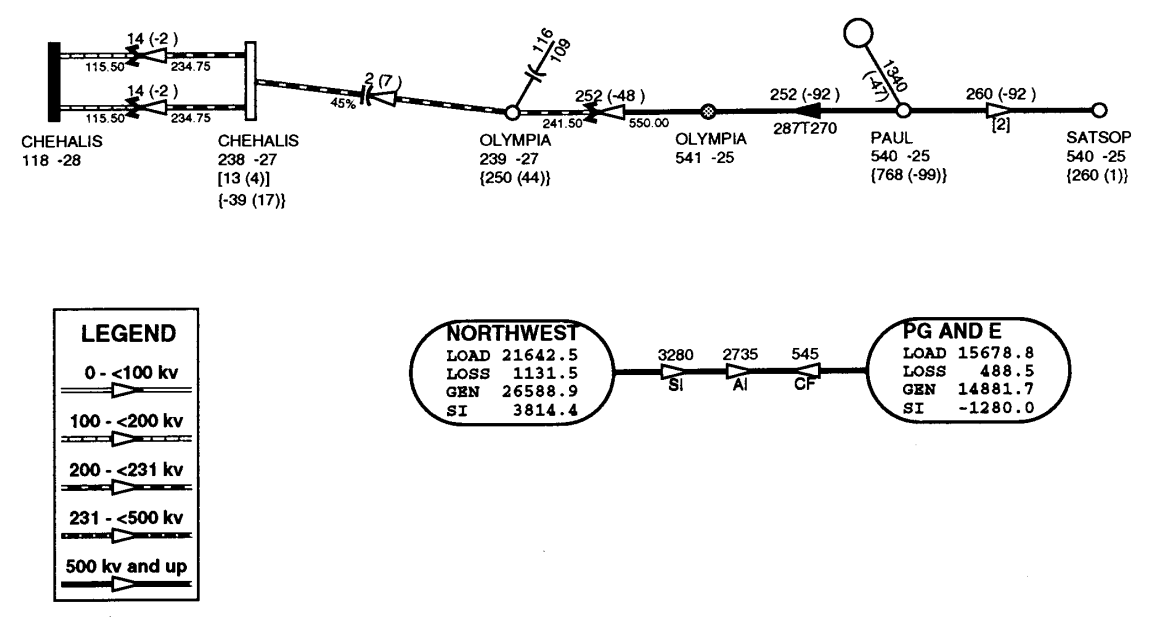
Fig. 152 Diagram Example
The bus symbol group and values consists of the following:
Bus symbol — Circle, bar, etc. In the figure above, the bus symbol is fully-shaded (black) — see CHEHALIS 115 — for undervoltage buses and half-shaded (gray) — see OLYMPIA 500 — for overvoltage buses.
Identification — Powerflow name and kV or abbreviation. The figure below shows buses with the abbreviated form of identification. The CHEHALIS 230 bus is abbreviated CHEHALIS.
Voltage and angle — Printed above, below, or to the left or right of identification. In the figure above, the CHEHALIS 230 bus voltage is 238 kV and angle -27 degrees.
Bus load - Printed above, below, or to the left or right of voltage and angle. In the figure above, the load at CHEHALIS 230 is 13 MW and 4 Mvar.
Total flow on branches to buses not shown on diagram — printed above, below, or to the left or right of load. In the figure above, the net flow at the CHEHALIS 230 bus on branches that are not shown on the diagram is 39 MW into the bus and 17 Mvar out of the bus.
Generator symbol — Circle connected to bus with a short line segment. Power generation in MW is printed above the line and reactive generation is printed below the line. The figure above shows the generation at PAUL 500 is 1340 MW and -47 Mvar. A close inspection of the data would show the actual generation is on a low voltage bus at the same location as PAUL 500.
Shunt Reactive — Capacitor or inductor symbol connected to a bus with a short line segment. Maximum reactance available at the bus is printed above the line, and actual reactance used is printed below the line. The figure above shows that 116 Mvar of capacitive reactance is available and 109 Mvar is used at OLYMPIA 230.
The branch symbol group and values consist of the following:
Line segment symbol - Voltage-coded line segment representing a line or transformer connection between buses. Note the relationship to the legend.
Arrow symbol - Indicates direction of real power flow through the branch. In the figure above, a solid-shaded arrow (black) indicates the branch is loaded at 100% or more of a rated capacity.
Overload indicator - Flags circuits that are approaching an overload condition. Branches that are approaching a nominal, thermal, bottleneck, or emergency loading are flagged with an N, T, B, or E under the arrow. The actual current or Mva flow in the line or transformer is before the numeric flag and the rating follows the flag. The figure above shows the PAUL 500 to OLYMPIA 500 line carrying 287 amps and is over 90% of the line’s thermal rating of 270 amps. The solid arrow indicates the line is over 100% of the rating. (This is contrived data, of course.)
Branch flow - Real and reactive power (MW and Mvar) Branch flow is shown above the arrow. Real and reactive sending and receiving end flows are differentiated as follows. MW values are simply shown as numbers. Mvar values are shown within parentheses. Receiving end values are shown within square brackets. Negative values indicate a flow opposite the arrow direction. In the figure above, branch flow is shown above the arrow. Real and reactive sending and receiving end flows are differentiated as follows. MW values are simply shown as numbers. Mvar values are shown within parentheses. Receiving end values are shown within square brackets. Negative values indicate a flow opposite the arrow direction. The power flowing from PAUL 500 to OLYMPIA 500 is 252 MW and -92 Mvar as measured at the sending end.
Branch flow — MVA and current. An alternative to showing MW and Mvar is to show MVA for transformers and current for lines. The value shown is the maximum for any section of the circuit. If the maximum is at a point other than the sending end, an R is appended to the flow. If a circuit is composed of both line sections and transformer sections, the maximum current for the line section and maximum MVA for the transformer section will be shown. The receiving or sending/receiving end flag is eliminated.
Example: .. image:: ../img/Example_500_amp_650_mva_Branch_Flow.png
This example indicates 500 amps in a line section and 650 MVA in a transformer.
Example: .. image:: ../img/Example_1000_amp_Branch_Flow.png
Branch flow - Real and reactive power loss. Real and reactive losses in MW and Mvar are shown above the arrow.
Example: .. image:: ../img/Example_Real_Reactive_Branch_Loss.png This example indicates a loss of 1.23 MW and 0.05 Mvar in the branch.
Parallel circuits - Show number of parallel circuits represented by branch (default). The number of parallel circuits carrying the flow on the diagram is shown in brackets below the line. The figure above shows two parallel circuits between PAUL and SATSOP carrying a total of 260 MW and -92 Mvar.
Parallel circuits - Show flow on each circuit represented (option). The flow on each of the parallel circuits can be shown separately. The figure above shows two parallel circuits between CHEHALIS 230 and CHEHALIS 115. Each circuit is carrying 14 MW and -2 Mvar.
Transformer symbol (shown at tip of arrow).
Transformer taps (shown below transformer). The fiture above shows the CHEHALIS 115/230 transformers with taps of 115.50 and 234.75.
Series compensation symbol (shown at tip of arrow).
Series compensation value - Percent of line compensation shown below capacitor symbol. The figure shows the CHEHALIS 230 to OLYMPIA 230 line with 45% compensation.
Primary Diagram Components: Interchange Diagram
The area interchange diagrams are quite simple, showing the area data within the area symbol (bubble), and flow data above the lines connecting areas.
The area symbol and data consists of the following:
Area symbol — Cartouche (bubble).
LOAD — Summation of all loads within the specified area.
LOSS — Summation of all losses within the specified area.
GEN — Summation of all generation within the specified area.
SI (Scheduled Interchange) — Export of power from the specified area.
The interchange symbol and data consists of the following:
Interchange symbol — Line with arrows and values for Scheduled Interchange, Actual Interchange, and Circulating Flow.
The values are shown above the arrows.
The example above shows that 3280 MW was scheduled from
NORTHWESTtoPG AND E. The actual interchange was 2735 MW. The circulating flow, defined as actual interchange minus scheduled interchange, is 545 MW fromPG AND EtoNORTHWEST.
Primary Diagram Components: Difference Diagram
The format of difference diagrams is very similar to the format of the standard diagram. The standard diagram uses only one case, an active case. The difference diagram uses two cases, an active case and an alternate case.
Displayed values are calculated as active case values minus alternate case values. Arrows indicate the direction of power flow in the active case.
If there are a different number of circuits in the active and reference cases, the number of circuits is in each case shown below the circuit.
Example

This example shows the active case has 3 circuits and the alternate case has 2 circuits in parallel.
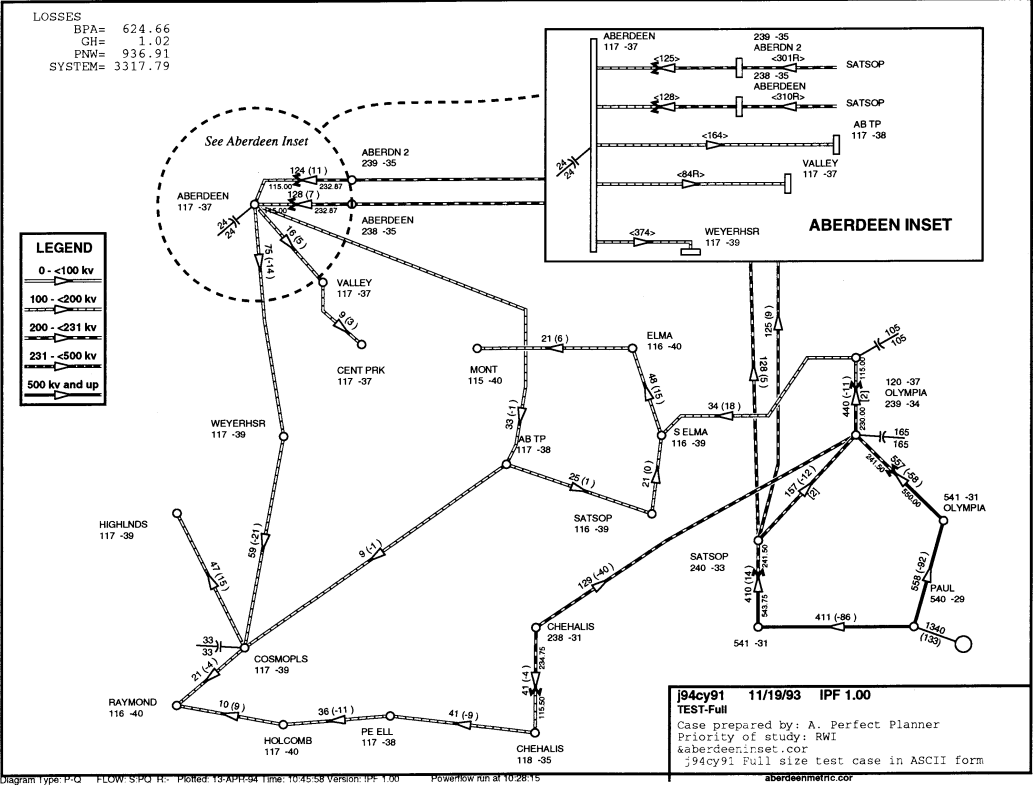
Fig. 153 Bus Branch Diagram with Inset
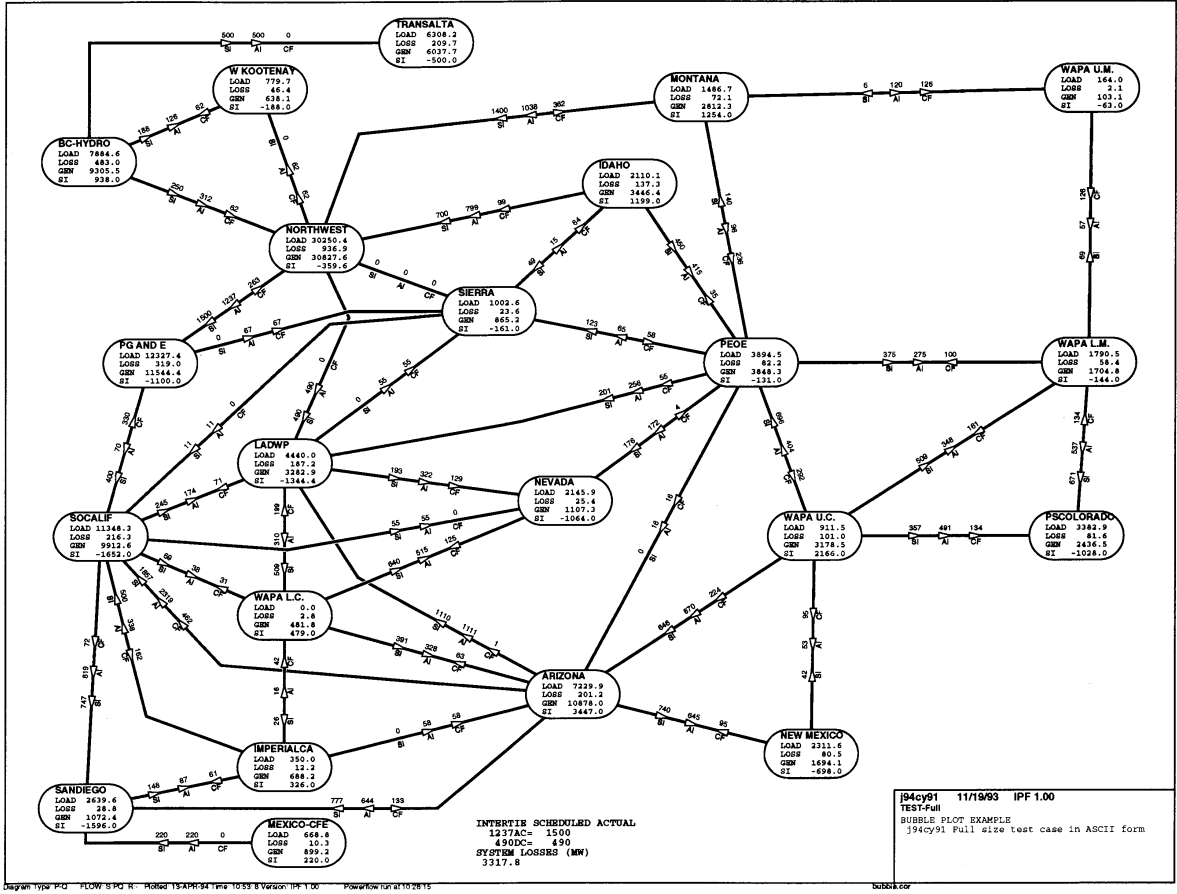
Fig. 154 Area Interchange Diagram
Comment Records
Comment records may display simple text or may be used in conjunction with >DEFINE records to display Powerflow values.
They may also be used in conjunction with CFLOW, to create mini-reports on the printed map. Your CFLOW program can edit a coordinate file directly, or create/edit an auxiliary file containing comment records, which is included in the main file(s) with an
OPtion = FIlerecord (see also PostScript records, above).Column
Format
Description
1
A 1
C - identifies a comment record.
3-14
2F 6.2
X, Y coordinates of comment. DEFAULT - after previous comment.
15-90
A 76
Comments.